As a person that has studied biodiversity for at least 18 years, I am well aware of its complexity. I know about the high number of existing taxonomic groups, the wealth of species within each of them, the wide possibilities for changing and overlapping names, of wrong identifications; I know the data management pitfalls, and the difficulty of detecting a biodiversity response in observational biodiversity studies.
One of the issues when dealing with the study of biodiversity is sampling. Sampling a specific taxonomic group in a given habitat type may range widely in several parameters, i.e., sampling unit size and shape, time spent on each sampling unit, number of experts involved, detection method. These parameters are numerous and add to issues relative to sampling design, such as the use of subunits or the sampling of specific substrates, that make sampling extremely variable within and across taxonomic groups.
For at least 10 years I have been working on multi-taxon datasets, their high complexity and the great effort needed to compare them took a lot of my energy, and sometimes hampered potential collaborations.
In the framework of the COST Action BOTTOMS-UP, we are collecting forest multi-taxon biodiversity and stand structure data across European countries. Being aware of the multidimensionality of sampling issues, even before starting to collect data on biodiversity or stand structure, we collected data on the protocols that were used to collect them. This was needed for us to understand the data we were going to collect, the comparability of sampling designs and effort.
On the one hand we soon realized that protocol wordy descriptions were essentially impossible to compare and to be accounted for in the analyses of biodiversity data. On the other hand the sampling parameters used for dozens of different taxonomic groups were extremely difficult to standardize.
The work I carried out together with Giovanni Trentanovi, of the University of Padua, required an iterative refinement of a table of protocol descriptions through close interactions with the custodians of 41 different multi-taxon datasets. We forced protocol descriptions (and custodians) into a series of sampling parameters, from sampling unit and subunit description to seasonal revisitations, that were designed to work for very different taxonomic groups, from spiders to epiphytic lichens.
We ended up with 37 columns to describe the sampling of the multi-taxon sampling across 41 datasets. Things were far easier for stand structure: 15 columns for standing trees and deadwood. These tables were the very basis of our study and are available as supplementary information (1 and 2). In both cases the degree of heterogeneity we found was not justified, since all the studies we considered pursued the same general goal of assessing the effect of forest management on biodiversity.
Giovanni got the idea for some fancy alluvial plots, to show not only the distributions of the individual sampling parameters, but also their combination and how these combinations varied across taxonomic groups. The first alluvial plot Giovanni prepared was definitely overambitious, it included more than 20 taxonomic groups and it was almost impossible to interpret. We decided to split the protocol data into four different plots that would compare different clusters of taxonomic groups: sessile organisms, invertebrates, vertebrates, and … less studied groups ... it was impossible to define a specific criterion for this group that included several groups of invertebrates from different phyla as well as soil microbes.
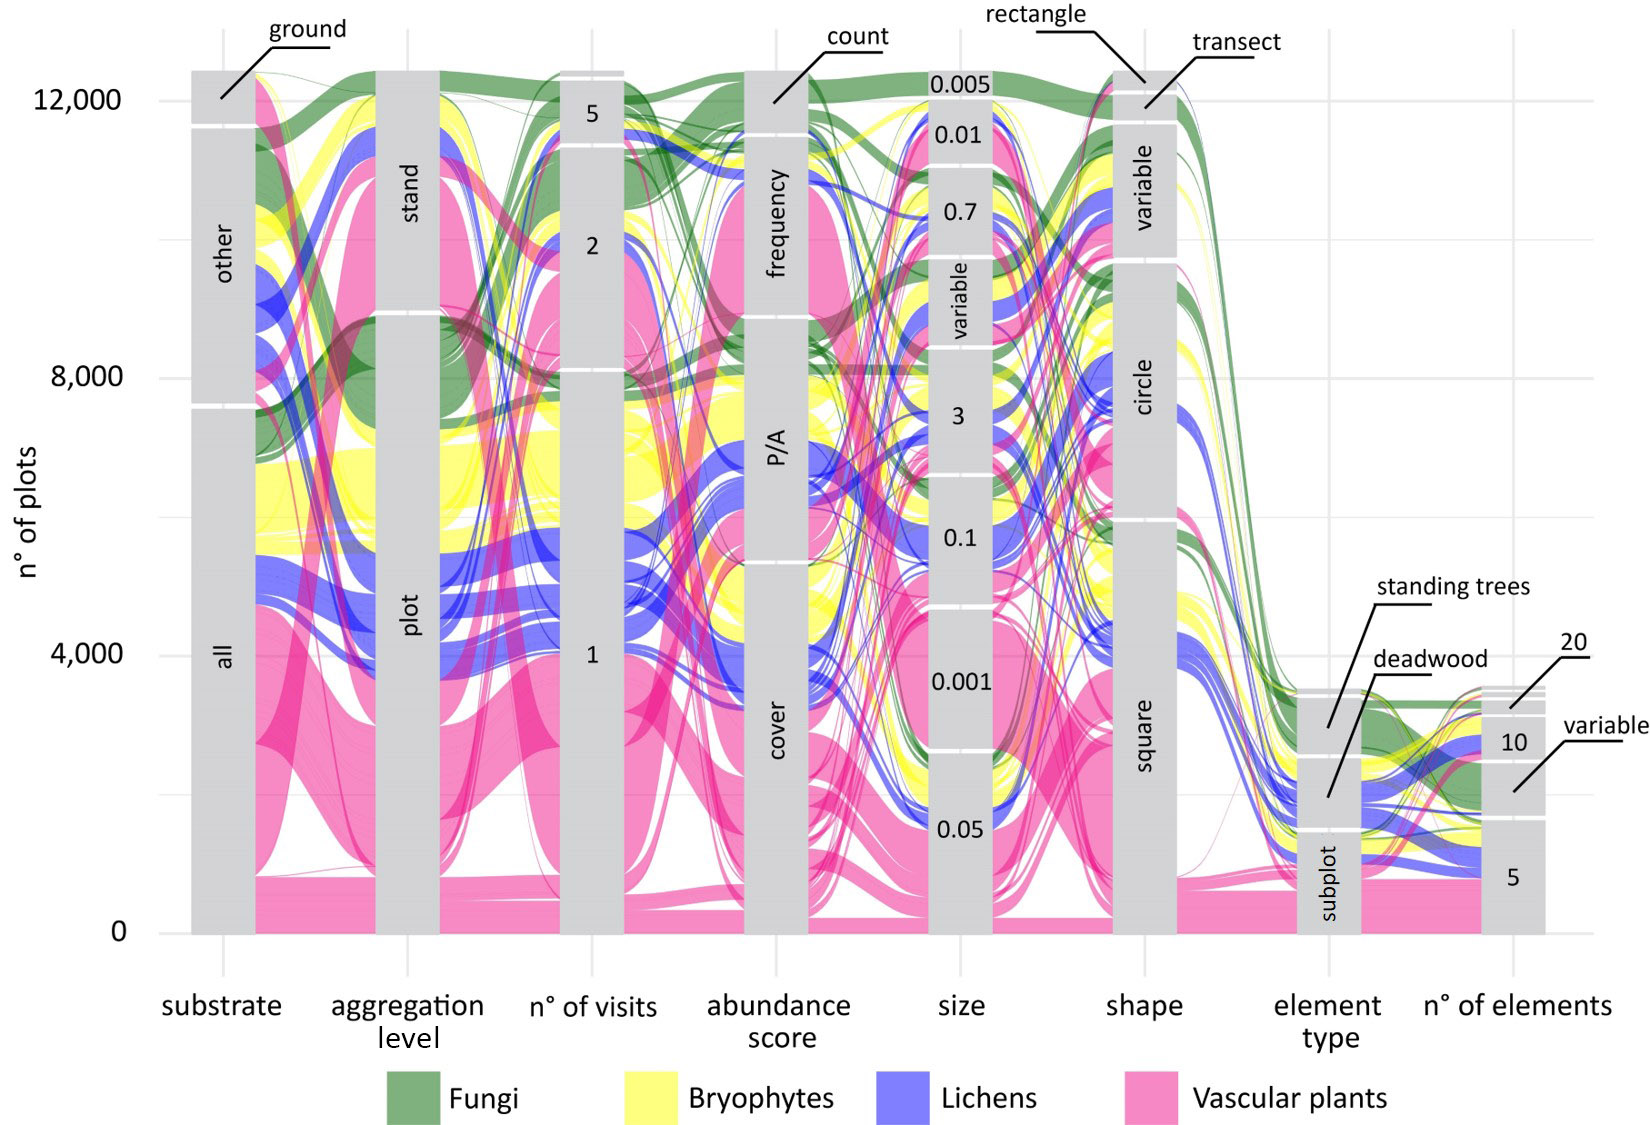
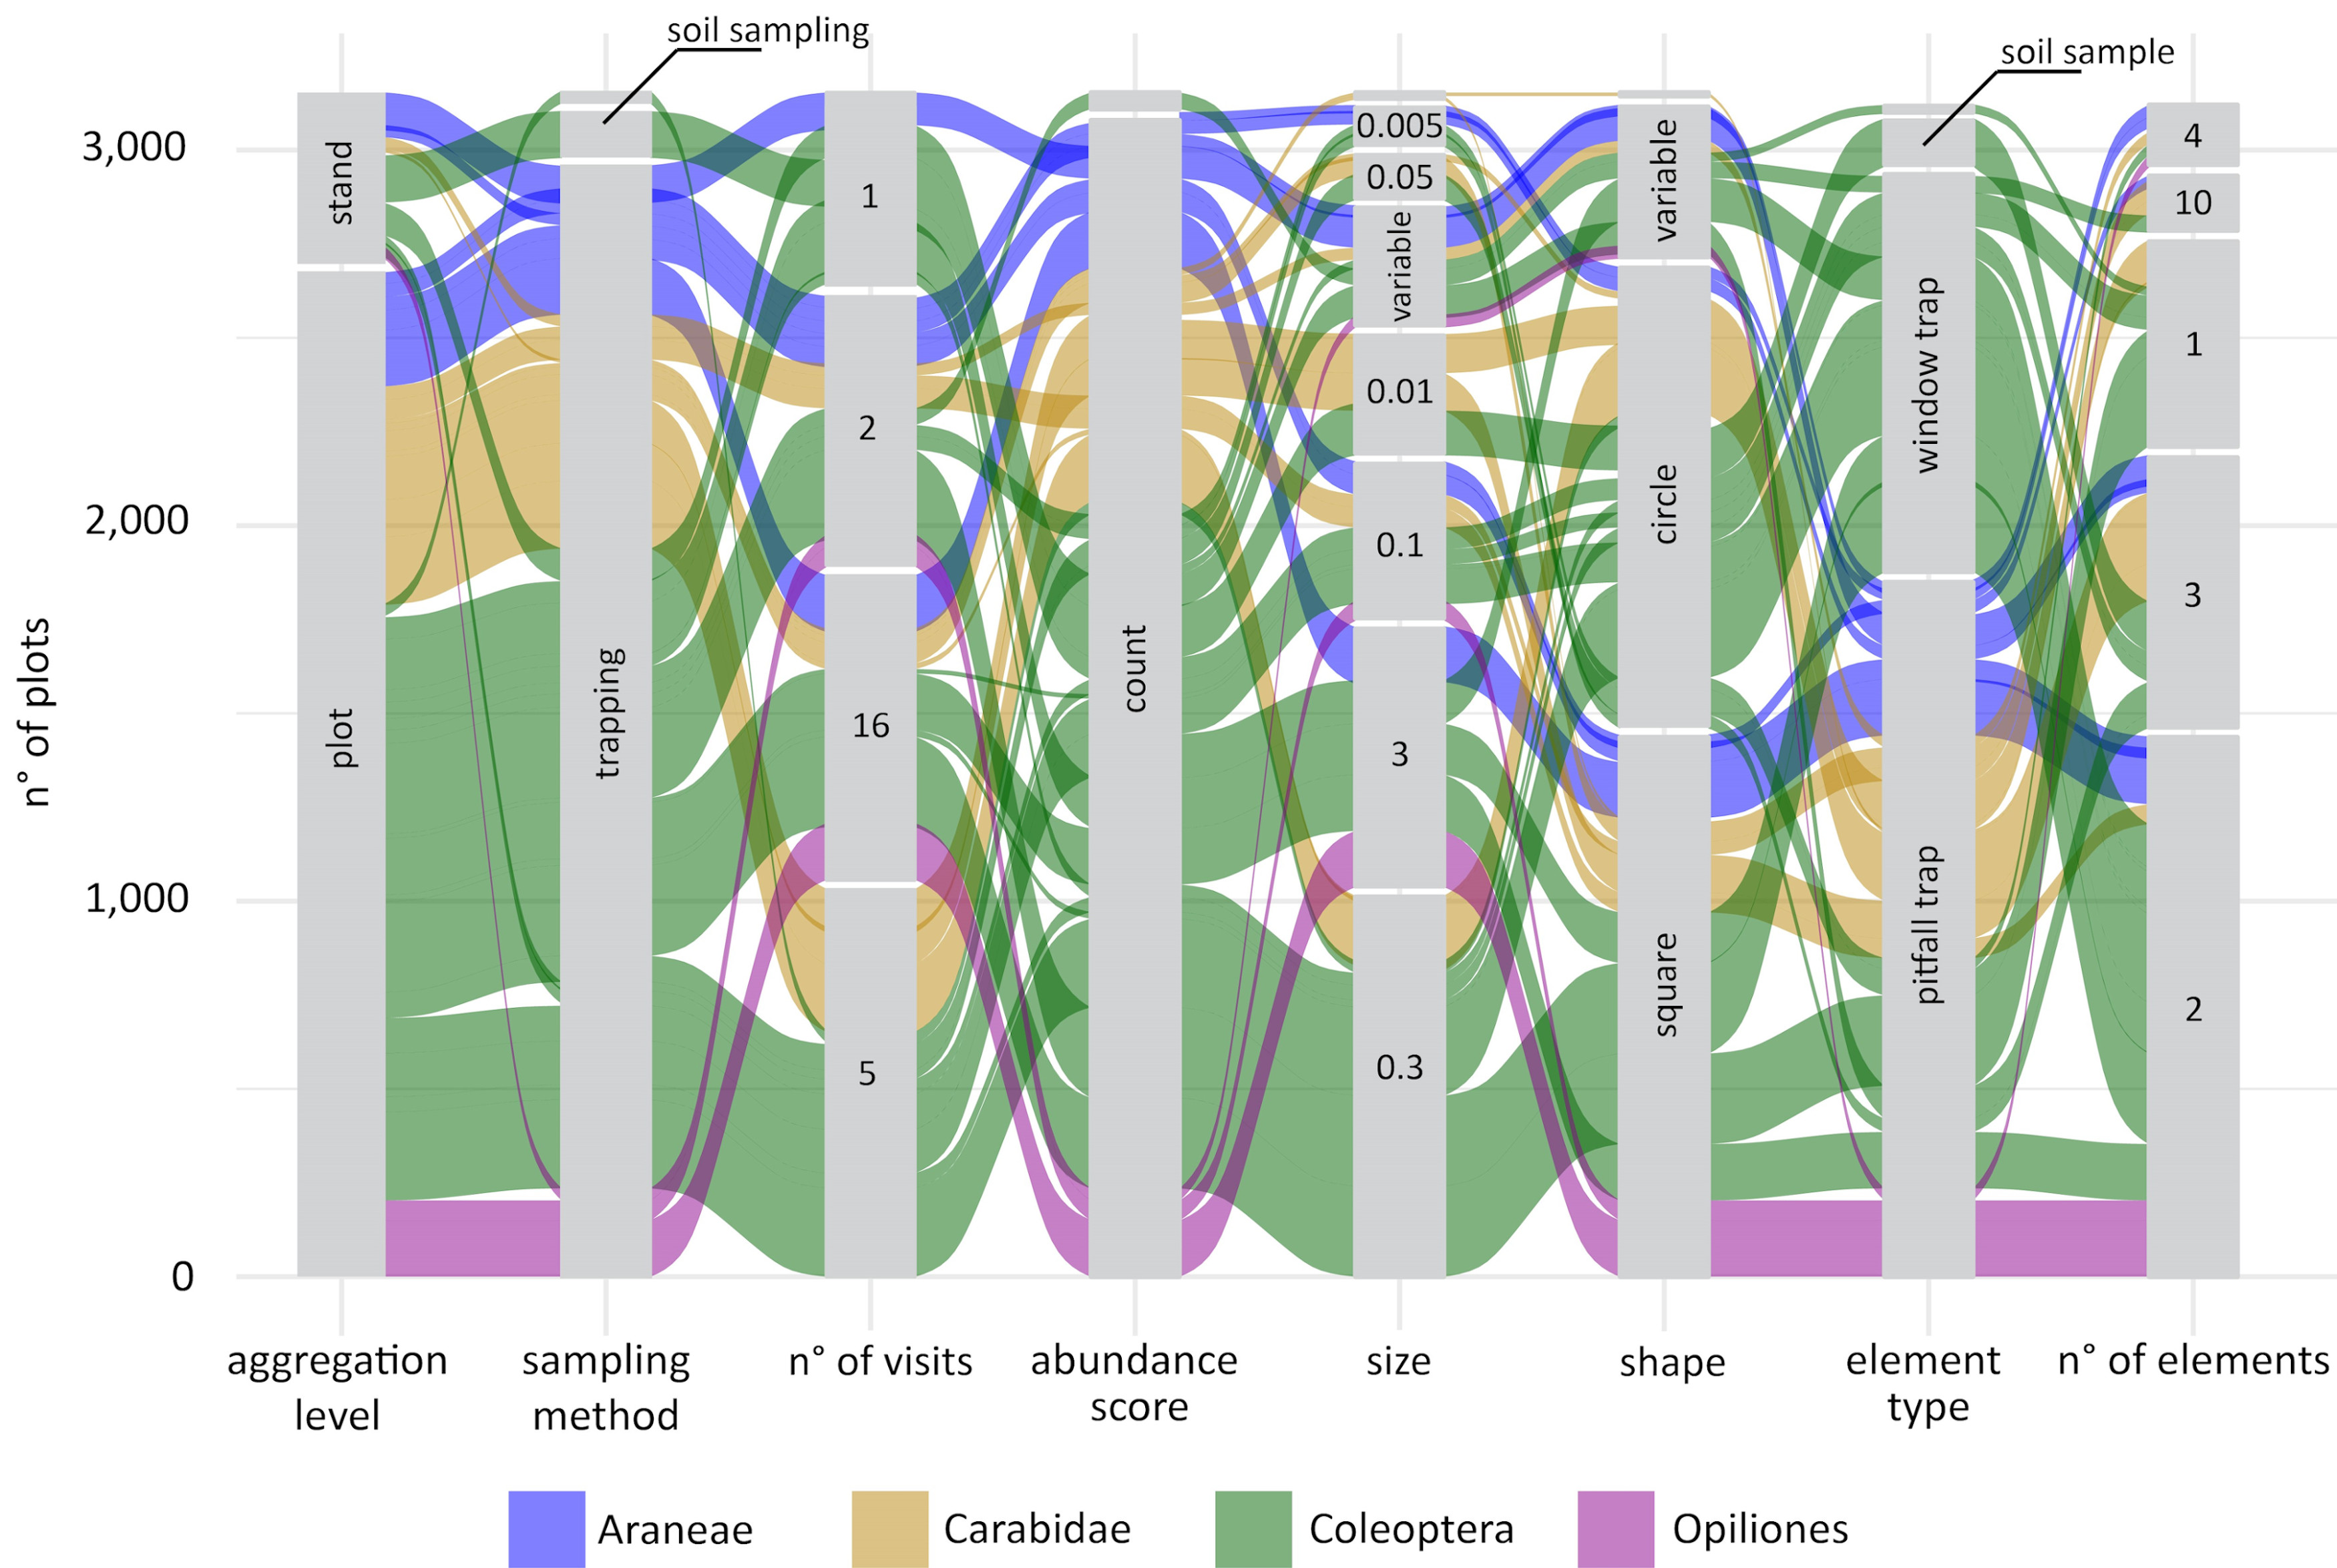
The alluvial plots were then sent to a large number of experts of different taxonomic groups to feed the discussion at the basis of the handbook to come.
I would like to say that the discussion process was smooth, but we got some hard moments in which it seemed difficult to find a solution that all the experts would certify as optimal.
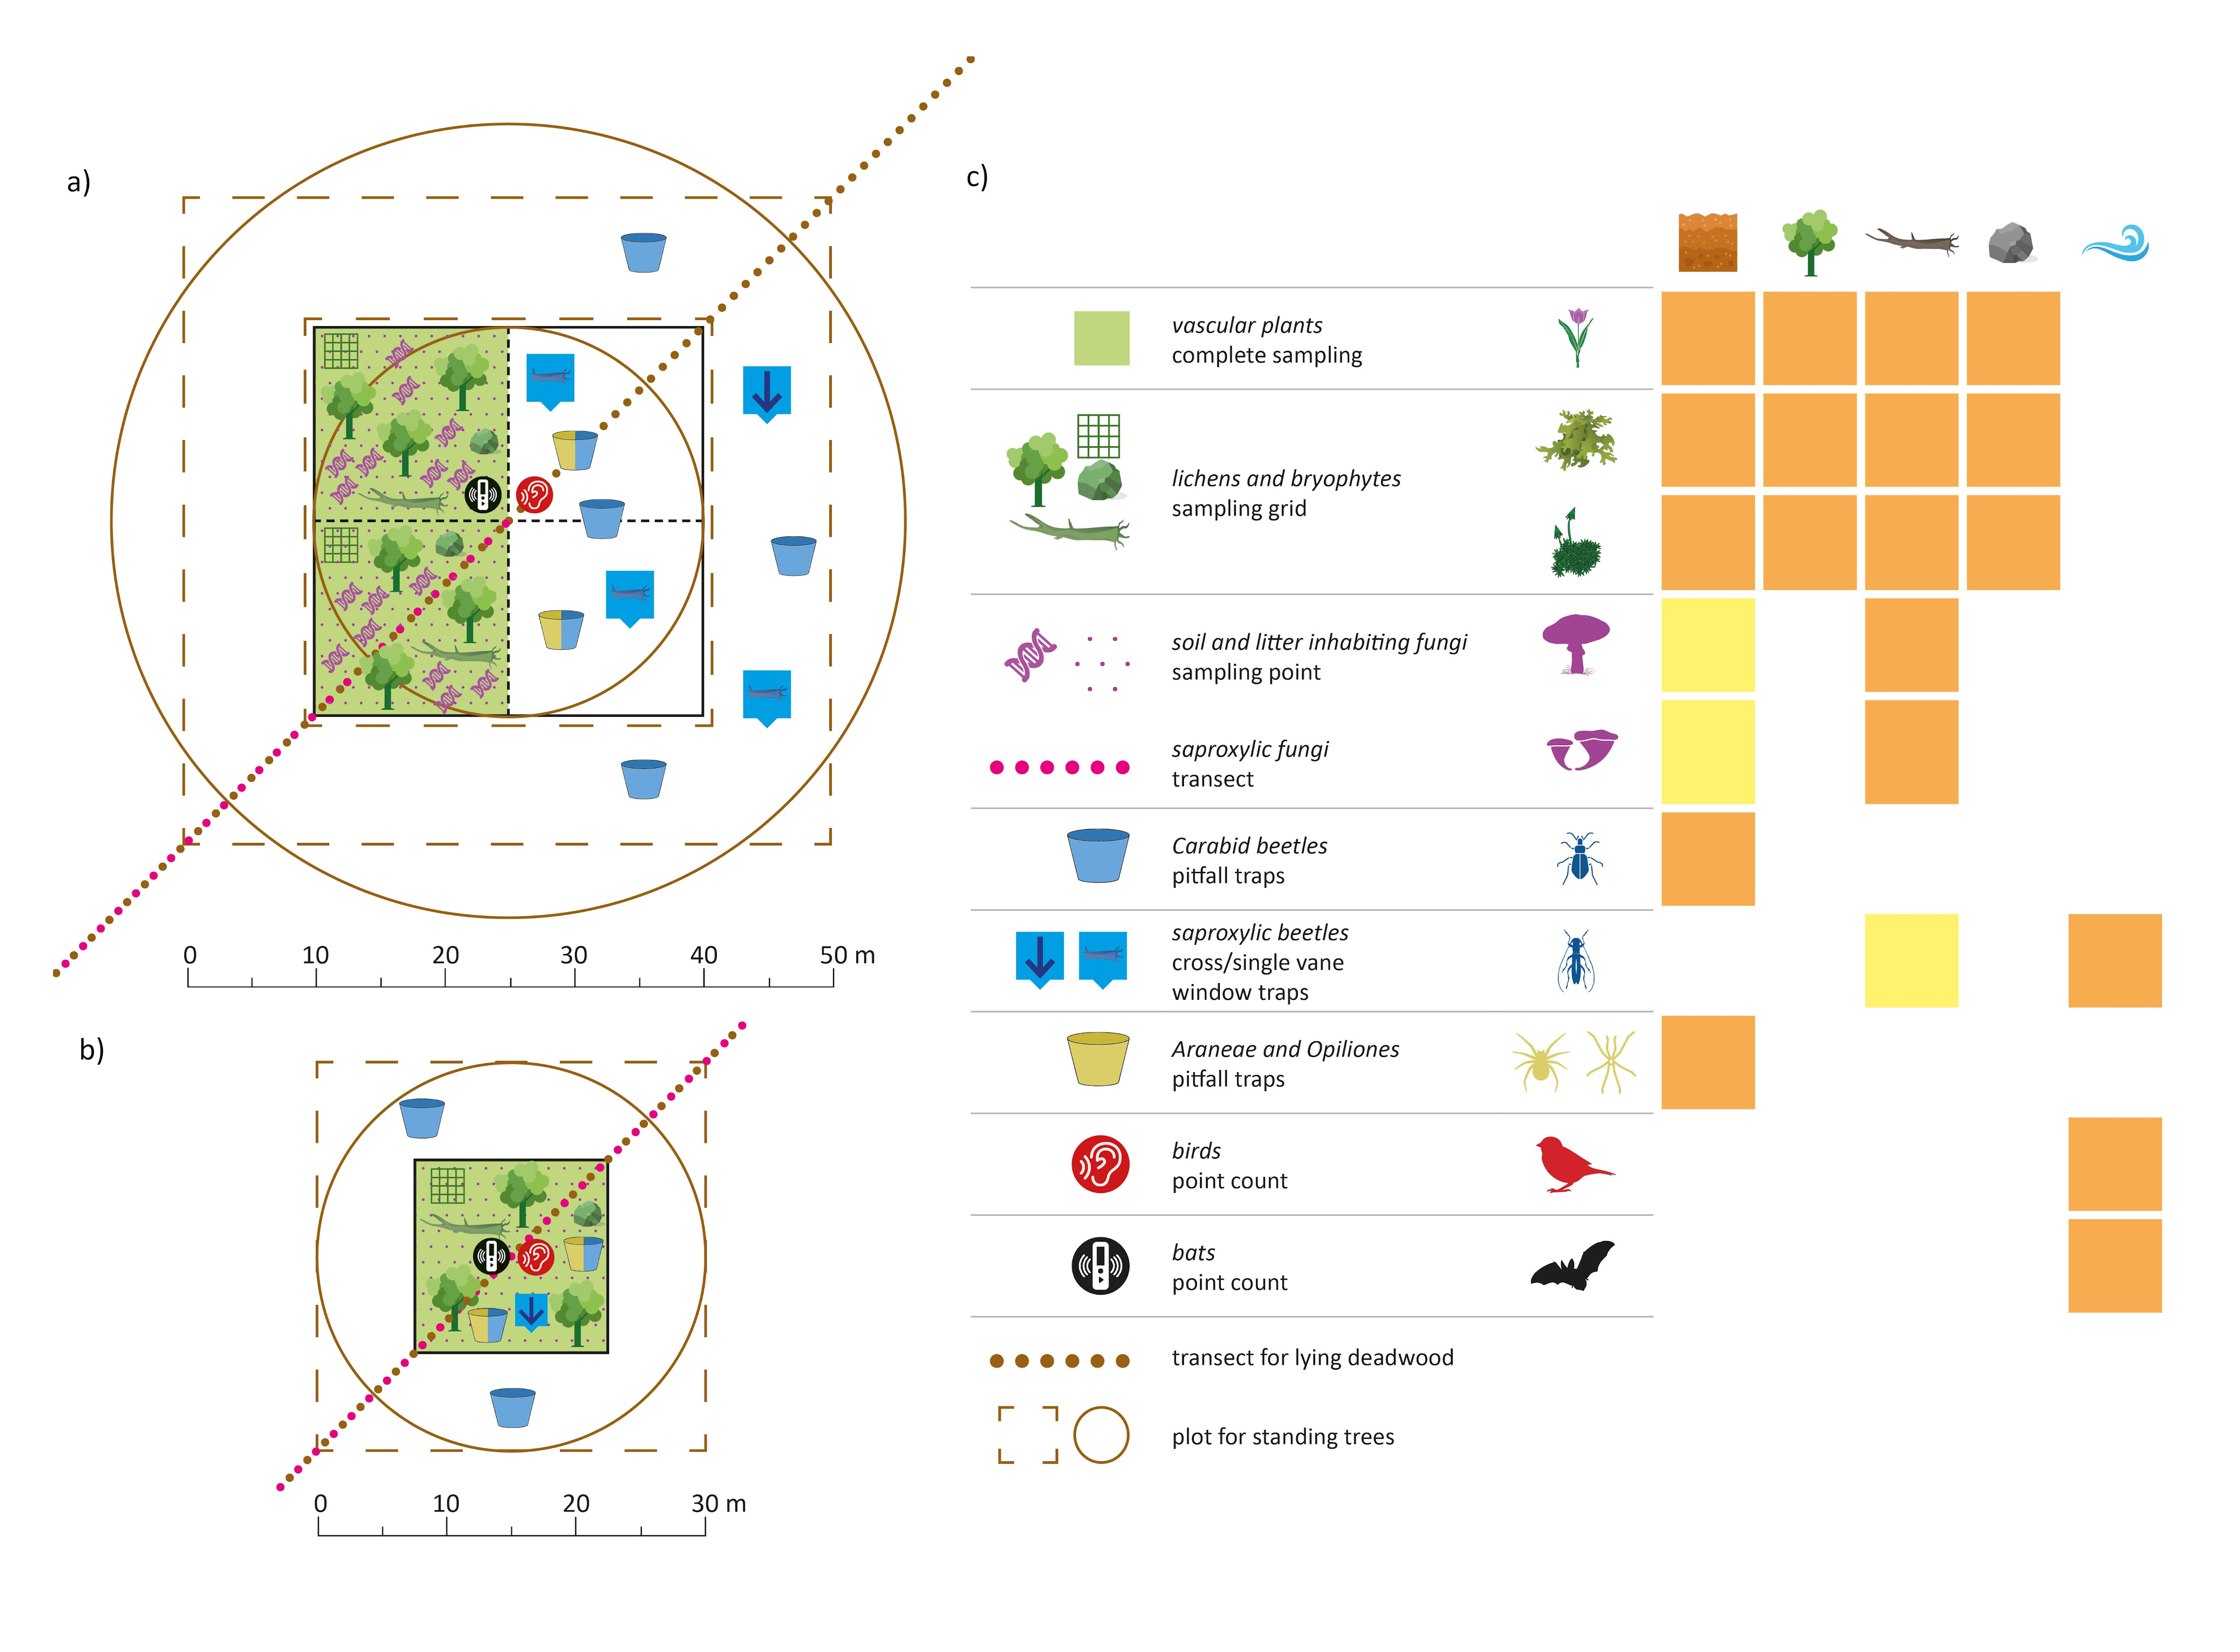
Eventually, we find a way to have the highest possible degree of comparability across the two sampling standards we propose, and across different taxonomic groups. We tried to be as clear as possible in the graphical and table representation of the protocols for ten different taxonomic groups and for the sampling of standing trees and lying deadwood (see the handbook here as supplementary data 3).
We are confident in the willingness of forest scientists to use these protocols in the future, even if this may mean to put aside some long lasting lab traditions. However, even if the protocols we propose will not be fully applied, surely they contributed future forest multi-taxon studies with a synthesis and a critical analysis of the approaches used up to now.
Overall, we think that the expert network and the discussion that stemmed within it are the real added value of the article, as it is often the case in COST Actions. The article that steps towards shared approaches and unified perspectives across biodiversity experts so that they may speak with one voice to policymakers designing forest monitoring and conservation actions.
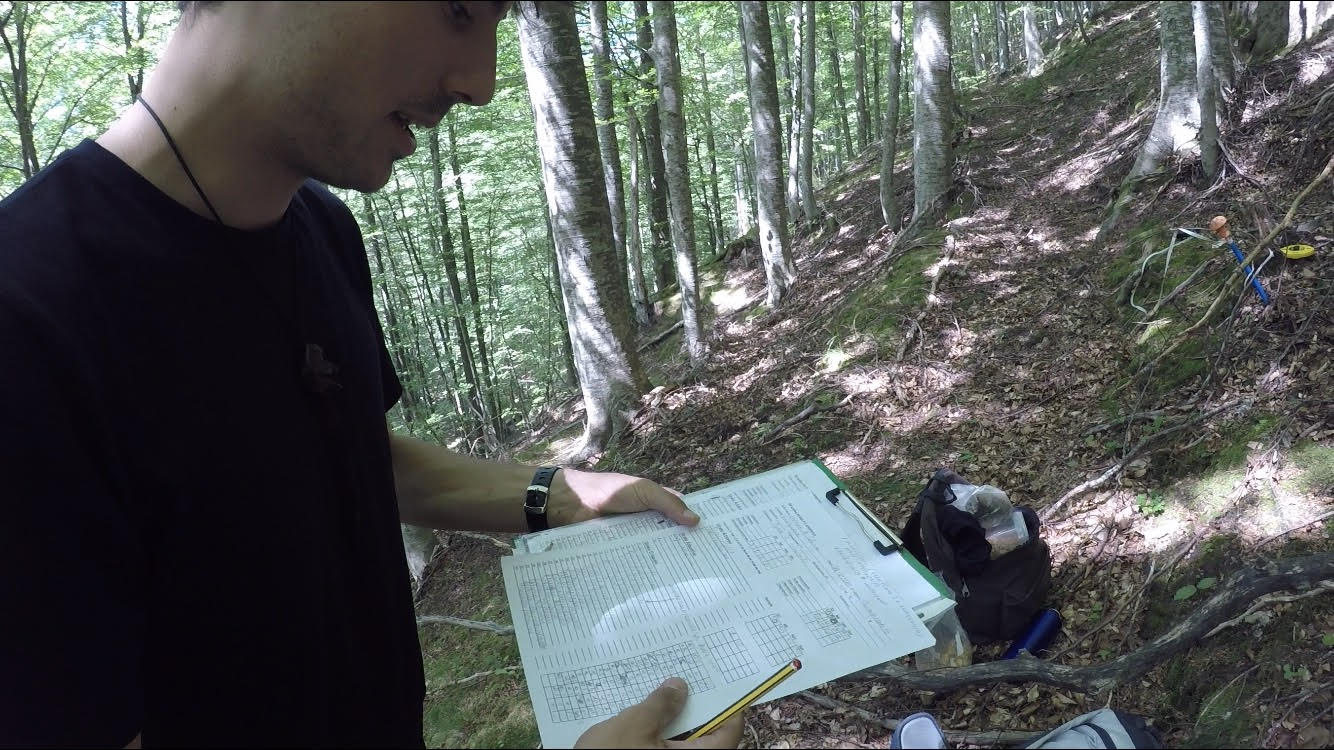
Post by Sabina Burrascano; Photo by Sabina Burrascano; Alluvial plots by Giovanni Trentanovi; Sampling unit scheme by Marco Petrini.